
Appearance
Approval statistics
How the approval machine is running: how many requests were raised, how many were approved, how many are still waiting, and how long approvers take.
Menu path Approve › Report
Address https://hub.cnvconnect.com/approvals/report
Permission approvals:view
Who uses it HR, managers
The screen
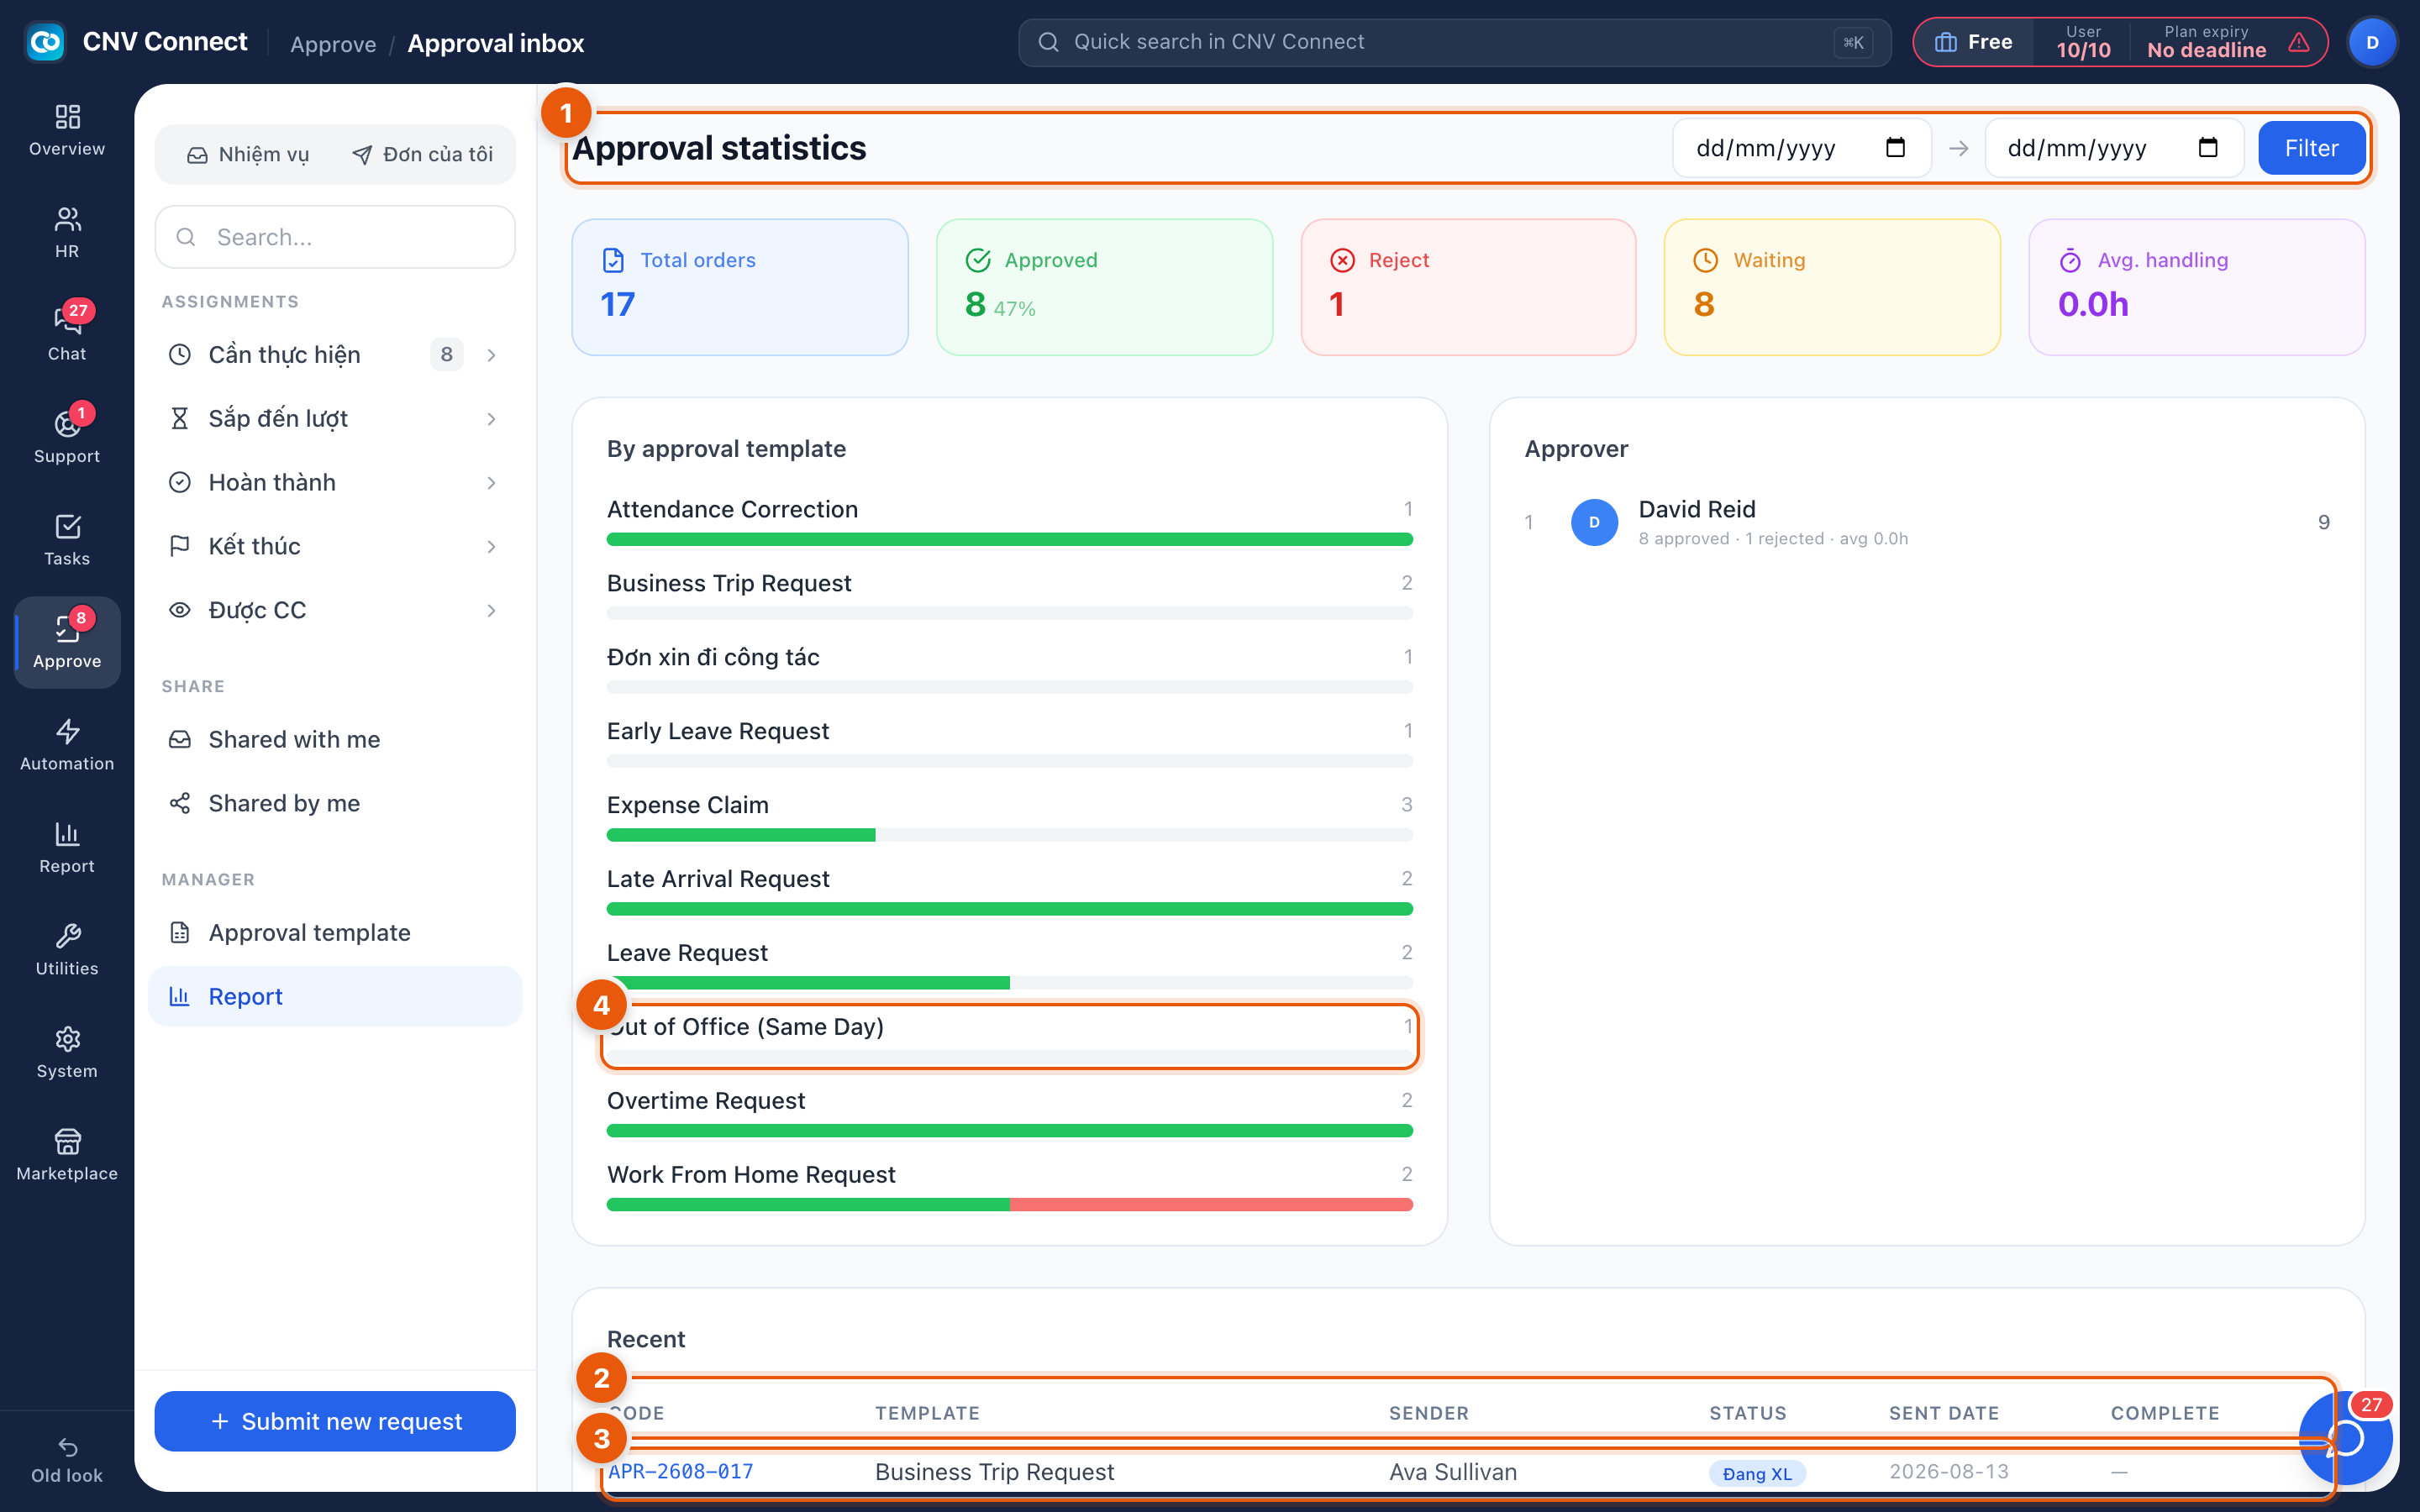
- Title and date filter — a from/to range with a Filter button. Everything on the page follows it. The summary tiles sit underneath: total requests, approved with its percentage, rejected, waiting, and average handling time.
- Recent columns — code, template, sender, status, sent date and completion date.
- A row — select it to open the request itself.
- Paging — the recent table is paged; the date filter above still applies.
How to…
Find the bottleneck
Read Waiting against Approved, then look at the Approver panel. A single approver with a long average time and a large queue is the answer most of the time.
Justify simplifying a process
By approval template shows which processes people actually use. A template with hundreds of requests and a 100 % approval rate is a candidate for automation or for fewer steps.
Track one request
Find it in Recent by code (APR-2608-017) and select it to open the request itself.
Notes
- Average handling time is measured from submission to final decision, so a request left over a weekend looks slow even if everybody acted promptly. Compare like with like.
- Some status labels in the table have not been translated yet and still appear in Vietnamese in the screenshot.
- This page is the audit view; day-to-day work belongs in the approval inbox.