
Appearance
Support dashboard
The health of the help desk in one screen: how many tickets came in, what they were about, who is carrying the load, and where the queue is slipping.
Menu path Support › Dashboard
Address https://hub.cnvconnect.com/tickets/dashboard
Permission support_dashboard:view
Who uses it support leads, managers
The screen
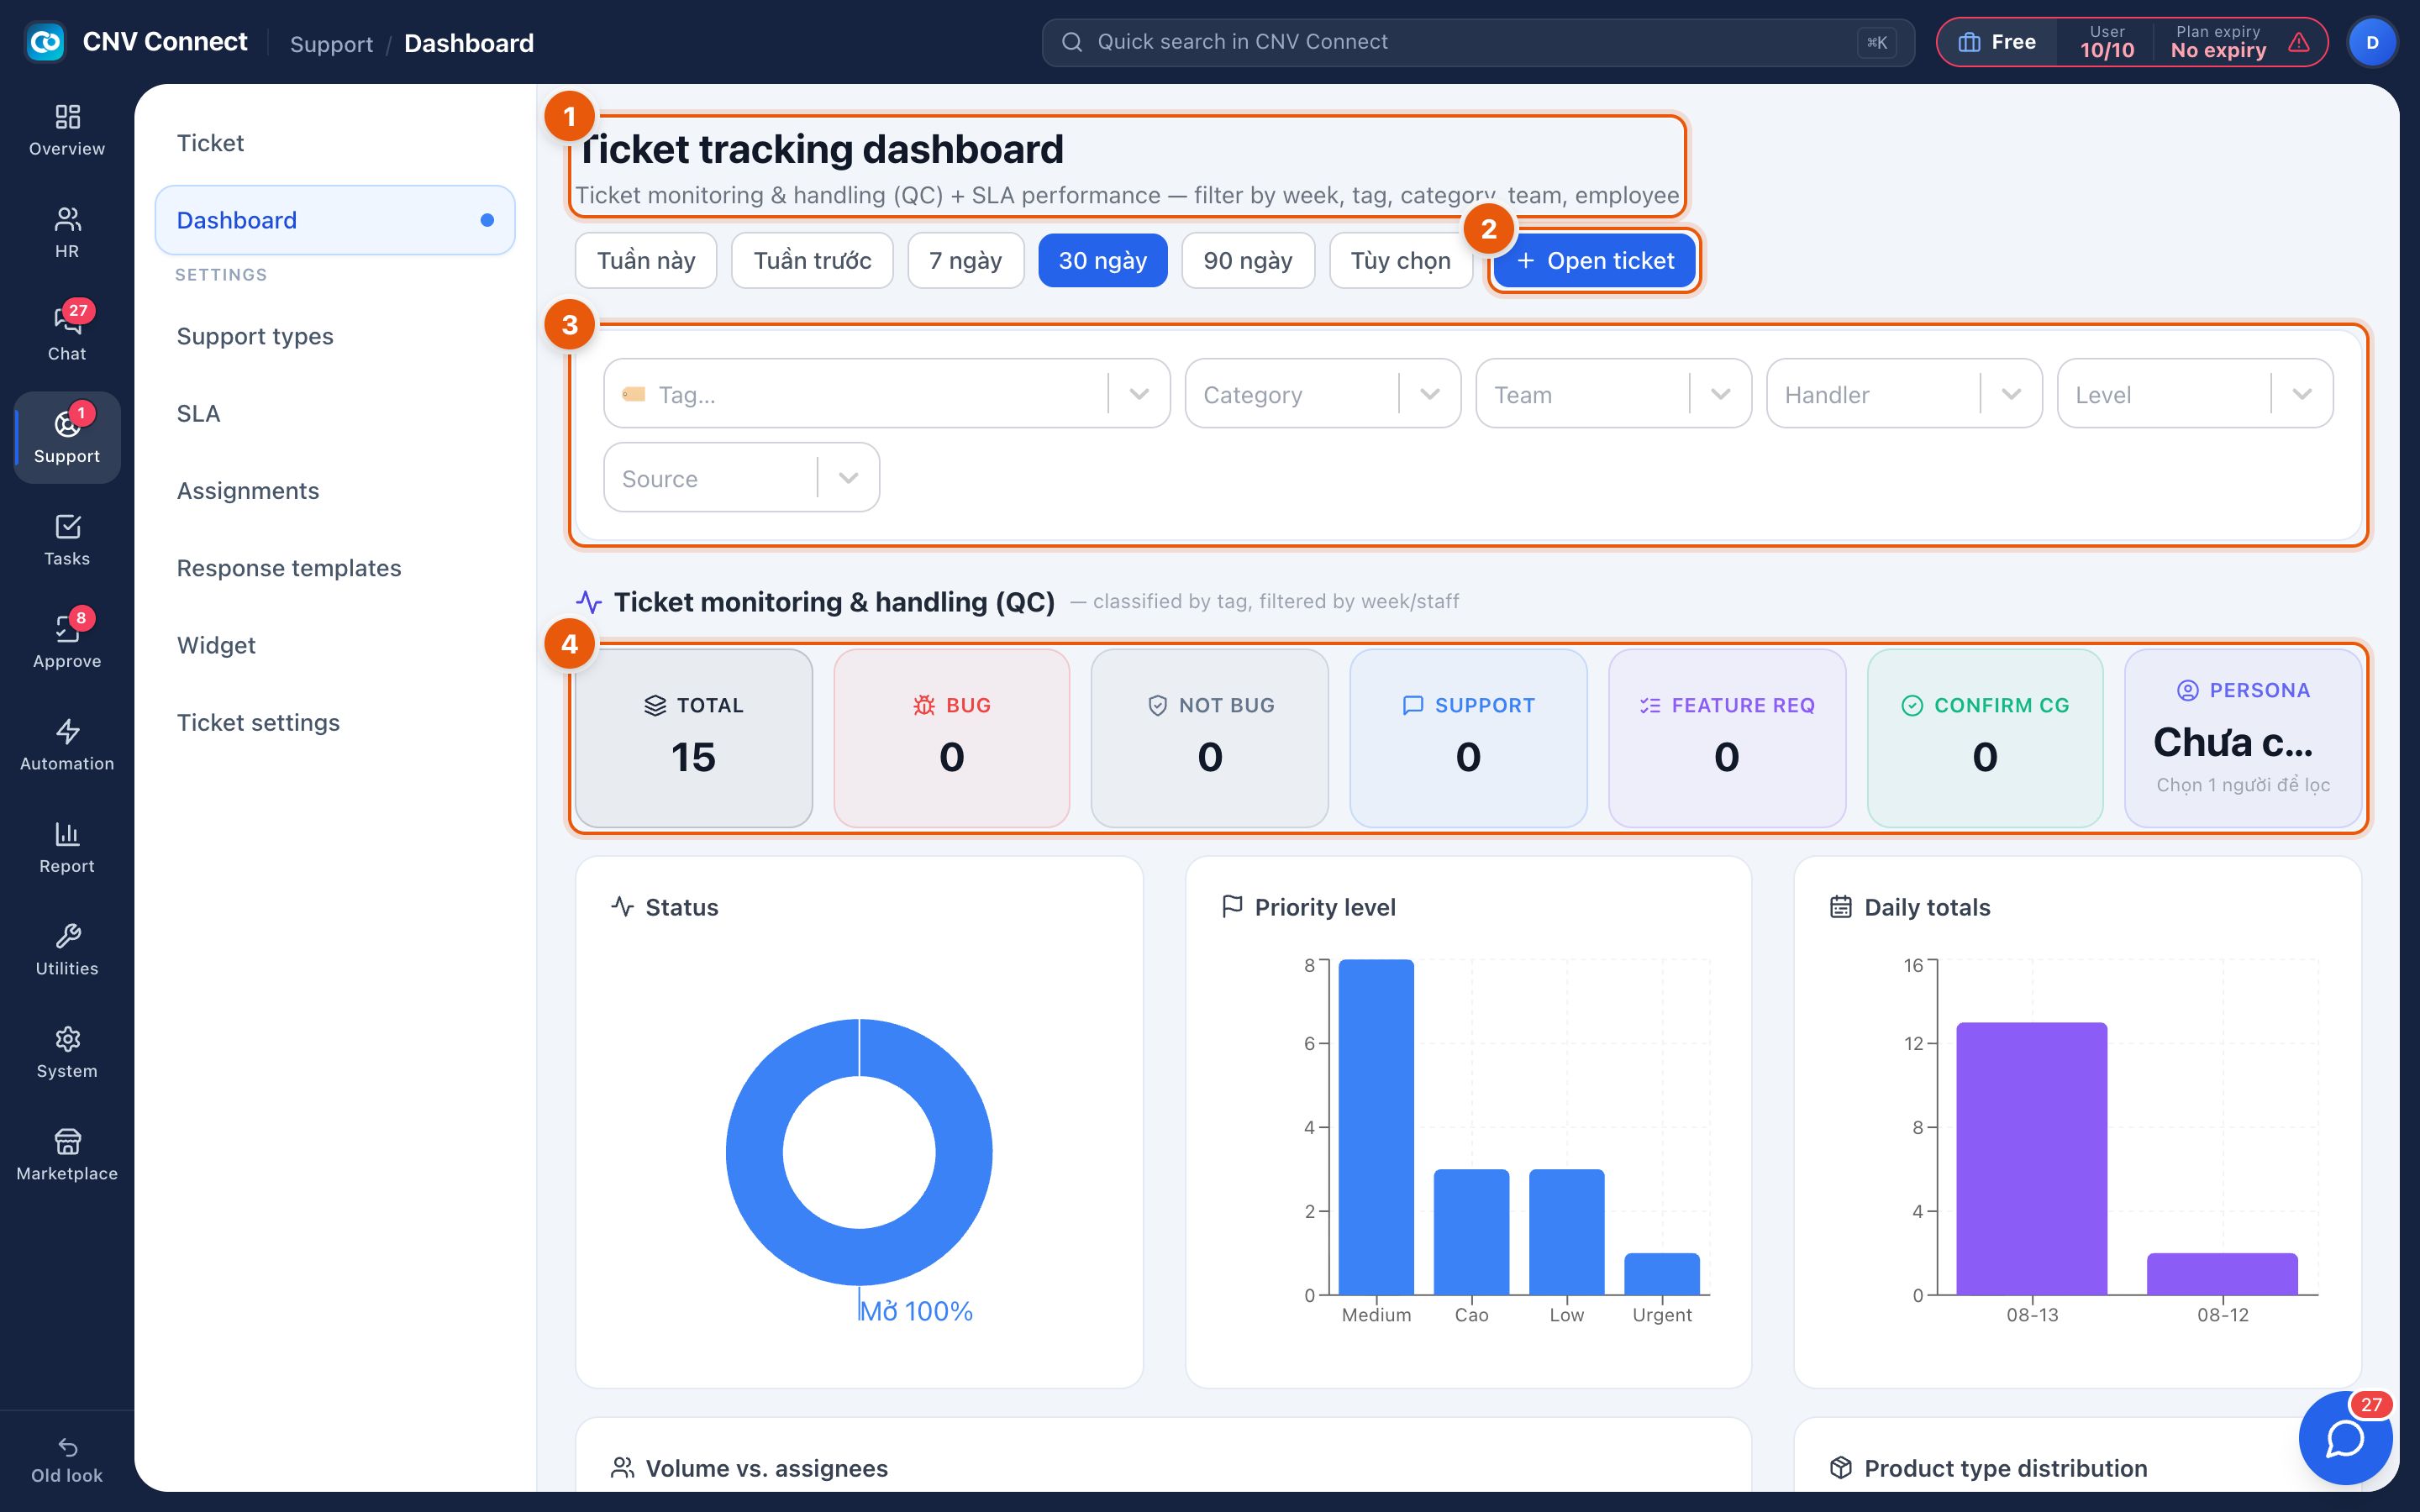
- Title and period — this week, last week, 7 days, 30 days, 90 days, or a custom range. Everything below follows this choice.
- Open ticket — raise a ticket without leaving the dashboard.
- Filter bar — tag, category, team, handler, level and source, for slicing the same period by any dimension.
- Classification counters — TOTAL and then the split: bug, not a bug, support, feature request, confirmation. They only add up if agents classify tickets.
How to…
Run a weekly review
- Set the period to this week.
- Read Daily totals for the shape of the week, then Volume vs. assignees for who absorbed it.
- Open the ticket queue filtered to SLA violations and go through what breached.
Find out what customers actually ask about
Use the classification counters and the product distribution. Both are only as good as the tagging discipline of your agents — an all-zero split means nobody is classifying.
Notes
- The QC panel is for reviewing how tickets were handled, not just how many.
- Charts read the same data as the queue; a number that disagrees with your own count is almost always a different period or a filter still applied.
- Panels with nothing to show display a "no data yet" message, which is not translated yet.